Advanced Monitoring
Use Sysdig to monitor your running application
In IBM Garage Method, one of the Operate practices is to automate application monitoring. Sysdig automates application monitoring, enabling an operator to view stats and collect metrics about a Kubernetes cluster and its deployments. The Developer Environment includes an IBM Cloud Monitoring with Sysdig service instance configured with a Sysdig agent installed in the environment’s cluster. Simply by deploying your application into the Developer Environment, Sysdig monitors it, just open the Sysdig web UI from the IBM Cloud dashboard to browse your application’s status.
Sysdig Monitoring
IBM Cloud Monitoring with Sysdig explains how to configure and use an instance of the Sysdig service, but the Developer Environment has already done most of this for you. You can skip steps 1-3 about user access, provisioning an instance, and installing an agent.
Sysdig dashboard
Open the Sysdig web UI for your environment’s cluster
- Step 4: Launch the web UI explains how to open the web UI
- In the IBM Cloud dashboard, navigate to Observability > Monitoring
- Find the monitoring instance named after your environment’s cluster, such as
showcase-dev-iks-sysdig
- In the monitoring instance, press the View Sysdig button to open the Sysdig web UI
Finish onboarding the agent
If this is your first time opening the Sysdig dashboard on your cluster’s monitoring agent, Sysdig will open the Onboarding wizard
The first page shows the hosts (i.e. Kubernetes nodes) and containers that Sysdig found, as well as the integrations it has selected to monitor them
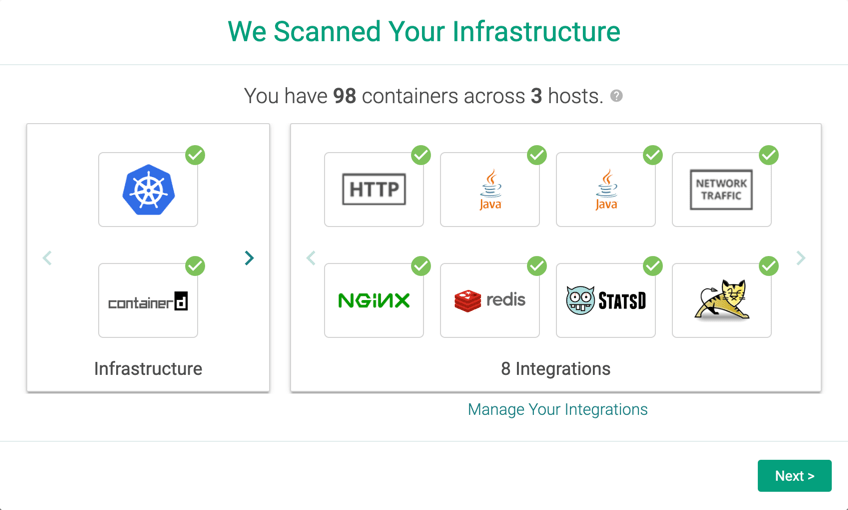 Notice there are different types of integrations for different types of runtimes such as Java, servers such as Tomcat,
and even infrasturcture integrations for monitoring the Kubernetes cluster itself and its containerd engines.
Notice there are different types of integrations for different types of runtimes such as Java, servers such as Tomcat,
and even infrasturcture integrations for monitoring the Kubernetes cluster itself and its containerd engines.Press Next
The second page shows the predefined metrics, dashboards, and alerts that Sysdig will start using to monitor the apps in your cluster
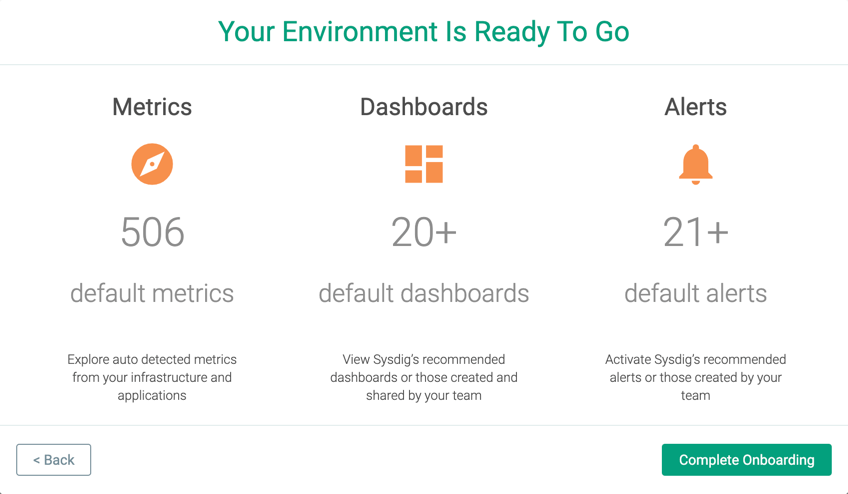 - Press **Complete Onboarding**
Explore your application
By default, the Sysdig dashboard opens the Explore page on its Deployments and Pods grouping.
- Select your cluster
By default, Sysdig opens its Overview by Process dashboard, which has panels showing stats about CPU, memory, and networking. This is one of Sysdig’s Default Dashboards (i.e. built-in dashboards).
These are the cumulative totals for all of the pods running in the cluster. Hover over a graph and a key pops up to list the pods and show each one’s color.
- Expand your cluster and namespace, then select your deployment
This shows the stats just for the pods in your deployment.
On the Dashboard page, you can create your own custom dashboards.
The Getting started tutorial, starting with Step 5: Monitor your environment, gives some instructions on monitoring, managing, and what to do next.
Give it a try
Before you start to understanding how to monitor your application instances, make sure you have deployed an app into your development cluster. This Git it a Try uses template-node-typescript as an example.
The SysDig service is already created, bound and configured to listen to monitoring metrics and events for your development cluster. You can see this in the HTTP overview.
- Open the SysDig instance that is named the same as your development cluster.
- Go to Dashboards > HTTP Overview
The dashboard shows stats for all incoming HTTP requests for all apps in the cluster. Browse through these views to get a feel for what they’re showing.
View your app’s metrics
Take a look at the metrics for your app.
Select the Explore page in the left nav menu
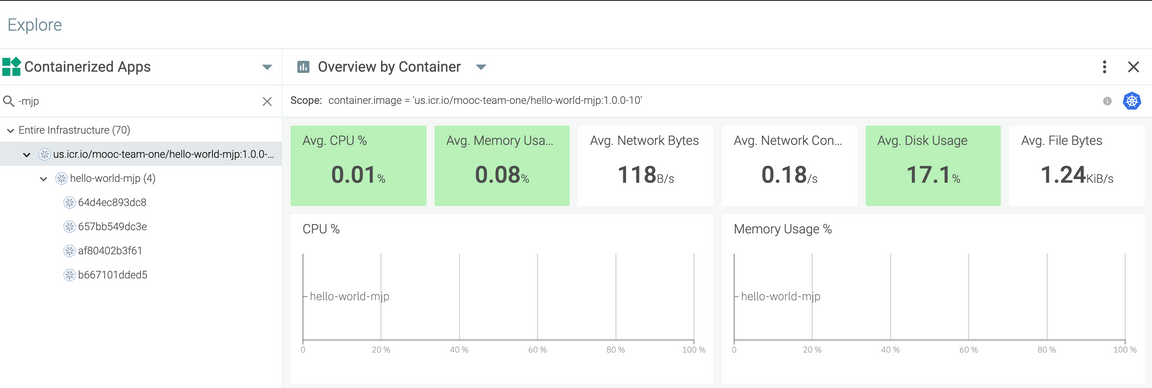
On the Explore page, select the Containerized Apps grouping
Search for your app, e.g.
hello-world-mjpIn the list of apps, select yours, e.g.
us.icr.io/mooc-team-one/hello-world-mjp:1.0.0-10With your app selected, select the Overview by Container dashboard
The Overview by Container dashboard shows metrics for the containers in your app. You will now see just the metrics for your your app. You can view at different levels—from pod to namespace to node to cluster—giving you a fine grain access to you monitoring requirements.
Creating a custom alert
SysDig enables monitoring for custom events and alerting for events. Let’s create a simple alert that will send an email when ever the total number of pods in your namespace/project exceeds a specific number. This is helpful to monitor when project is consuming unnecessary resources in the development environment.
Note: This is not tracking the number of pods in an application, but the number of pods (for all applications) in a namespace/project.
Add Notification Channel
Create a notification channel, which is how SysDig will send you an alert.
- In the SysDig dashboard, press the button with your initials at the bottom of the left nav menu, and select Settings
- In the Settings page, select Notification Channels
- Press Add Notification Channel and select email as the channel type
- Enter your business email address and give your channel a name, e.g.
MJP Dev Channel - Press Save
- Using the
...menu, send a test notification and verify that it arrives into your email account
Add Alert
Create an alert, which notifies you when an event occurs.
- Select the Alerts page in the left nav menu
- Press Add Alert and select Metric
The New Alert/Metric wizard enables you to configure a wide range of alerts.
Select the default title, “New Metric Alert”, and edit it to name the alert, e.g.
MJP Dev MetricChange the severity to red
HighIn Section 1: Define of th wizard, complete the fields as shown
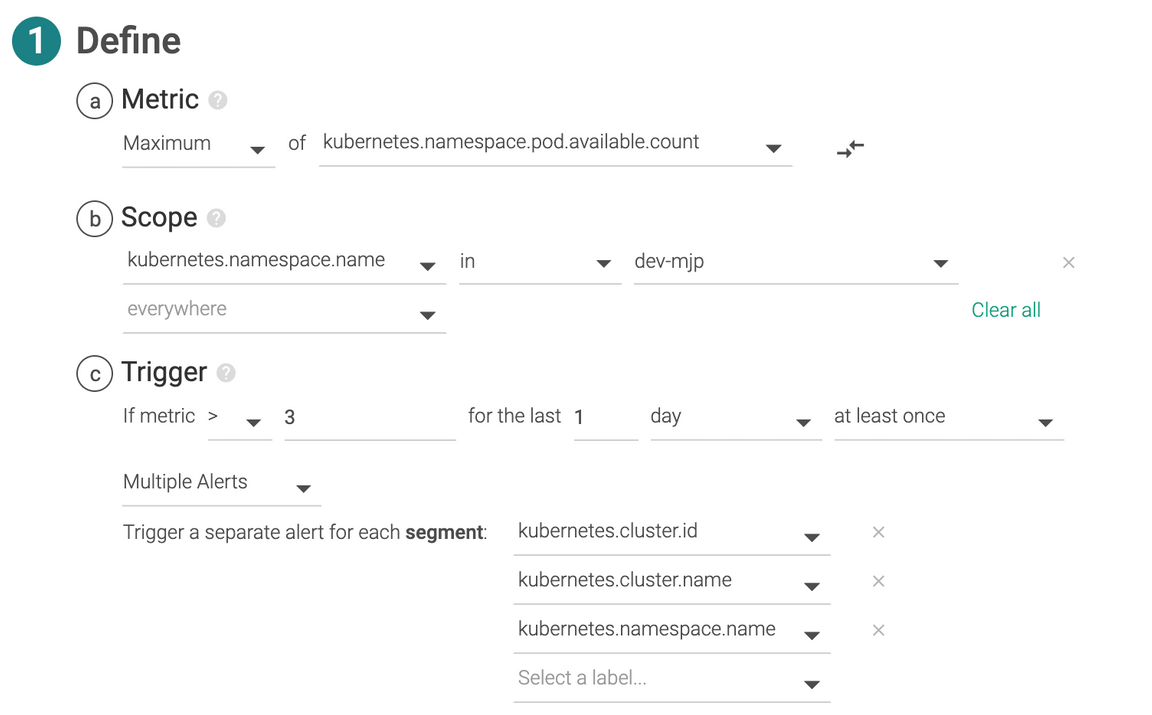 This alert will trigger after the number of pods (in any/all applications) in your namespace/project raises above 3. This will only trigger for your own developer space, make sure this is set to the one you use for deploying your applications, e.g.
 dev-mjp.In Section 2: Notify of the wizard, switch on the notification channel you created earlier, e.g.
MJP Dev ChannelSet it to notify you every 2 minutes
In the Notification Subject & Event Title field, add your namespace to the end, e.g.
- Dev-MJP namespace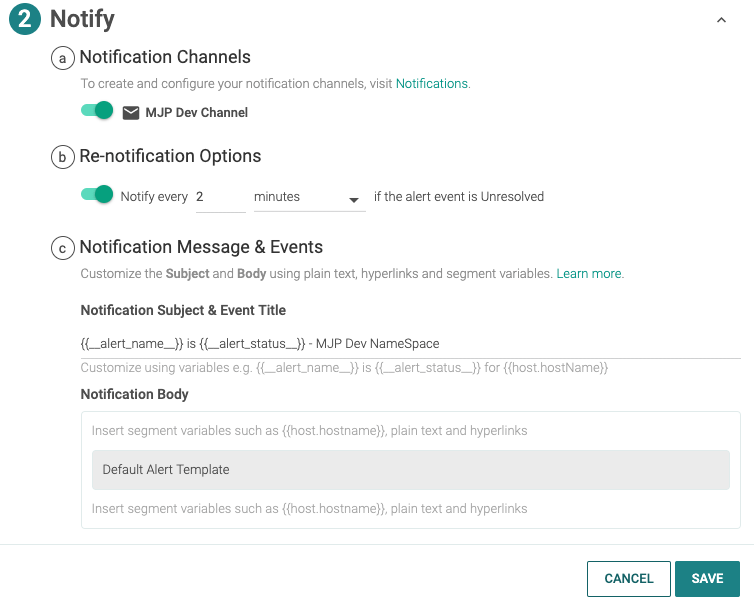
Press Save
Cause the event
Let’s test your alert by causing the event to occur.
- Back in your OpenShift or Kubernetes dashboard, navigate to your namespace/project and its deploments
- Select the deployment for your app and increase the number of pods for your app to 4
Once your app has started 4 pods/replicas, your namespace/project will be running more than the 3 pods your alert is monitoring for.
Acknowledge your event
Watch the container count
While starting pods goes very quickly, SysDig monitoring is not instantaneous. It will take 2-20 min for monitoring to detect the event.
- Back in the SysDig dashboard, navigate to your app again
- Explore > Containerized Apps
- Select your app to display the Overview by Container Image dashboard
Wait and watch for the container count to rise to 4. (Again, this could take 2-20 min. Watch for the times along the bottom of the graph to finally change.)
Watch for the event
Look for the event showing that your condition has been detected.
Select the Events page in the left nav menu
In the search field, enter the name of your app, i.e.
hello-world-mjpLook for an event named “{alert} is Triggered - {namespace} namespace”
{alert} is the name of the alert you created, e.g.
MJP Dev Metric{namespace} is the name of your namespace/project, e.g.
dev-mjp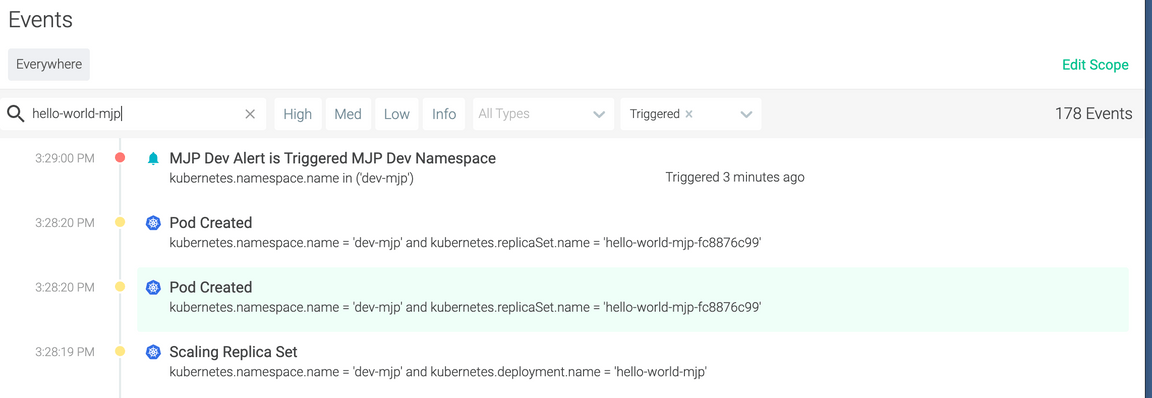
If you’ve already waited a few minutes until the container count increased to 4, you should see this event immediately. Otherwise, you need to wait (2-20 min?) until monitoring detects the change, triggers the alert, and logs the event.
Watch for the alerts
Once the event is displayed, check your email. You should get an email from Sysdig Notifications <ibm-saas-emailer@sysdig.com> with the subject “{alert} is Triggered - {namespace} namespace” (same as the event label). It says the metric is kubernetes.namespace.pod.available.count and the value is the number of pods in your namespace/project, at least 4 — plus a bunch of other info about the event.
From: Sysdig Notifications <ibm-saas-emailer@sysdig.com>To: "Matthew J Perrins"Subject: MJP Dev Alert is Triggered - Dev-MJP namespaceEvent Generated:Severity HighMetric kubernetes.namespace.pod.available.count = 4Segment kubernetes.cluster.id = '75240dcc-0326-11ea-be8d-eadf5501b087' and kubernetes.cluster.name = 'default' and kubernetes.namespace.name = 'dev-mjp'Scope kubernetes.namespace.name in dev-mjp
Wait awhile and you should get more emails notifying you about this event, 1 email about every 10 min. The event is only listed once in the Events view, when the condition was first detected. But SysDig will continue to notify you about the event until you acknowledge it.
Acknowledge the event
Tell SysDig you’re aware of the event.
Select the event and press Acknowledge
This will inform the monitoring that an operations team member is working the issue.
Alerting will send you one more alert email, subject “{alert} is Acknowledged - {namespace} namespace”, informing you that the event has been acknowledged. Then it won’t send you any more alert emails about this event.
Conclusion
It’s important to be able to monitor your deployed applications. Here, the Developer Environment uses Sysdig Monitoring, but you never had to install or run Sysdig. Just deploy your application into the Developer Environment and it gets moniotored automatically. After deploying your application, open the Sysdig web UI and browse the status, including the status of your cluster as a whole and your deployment in particular.
Learn more
Learn more about using SysDig Monitoring: